Dashboard and Observability
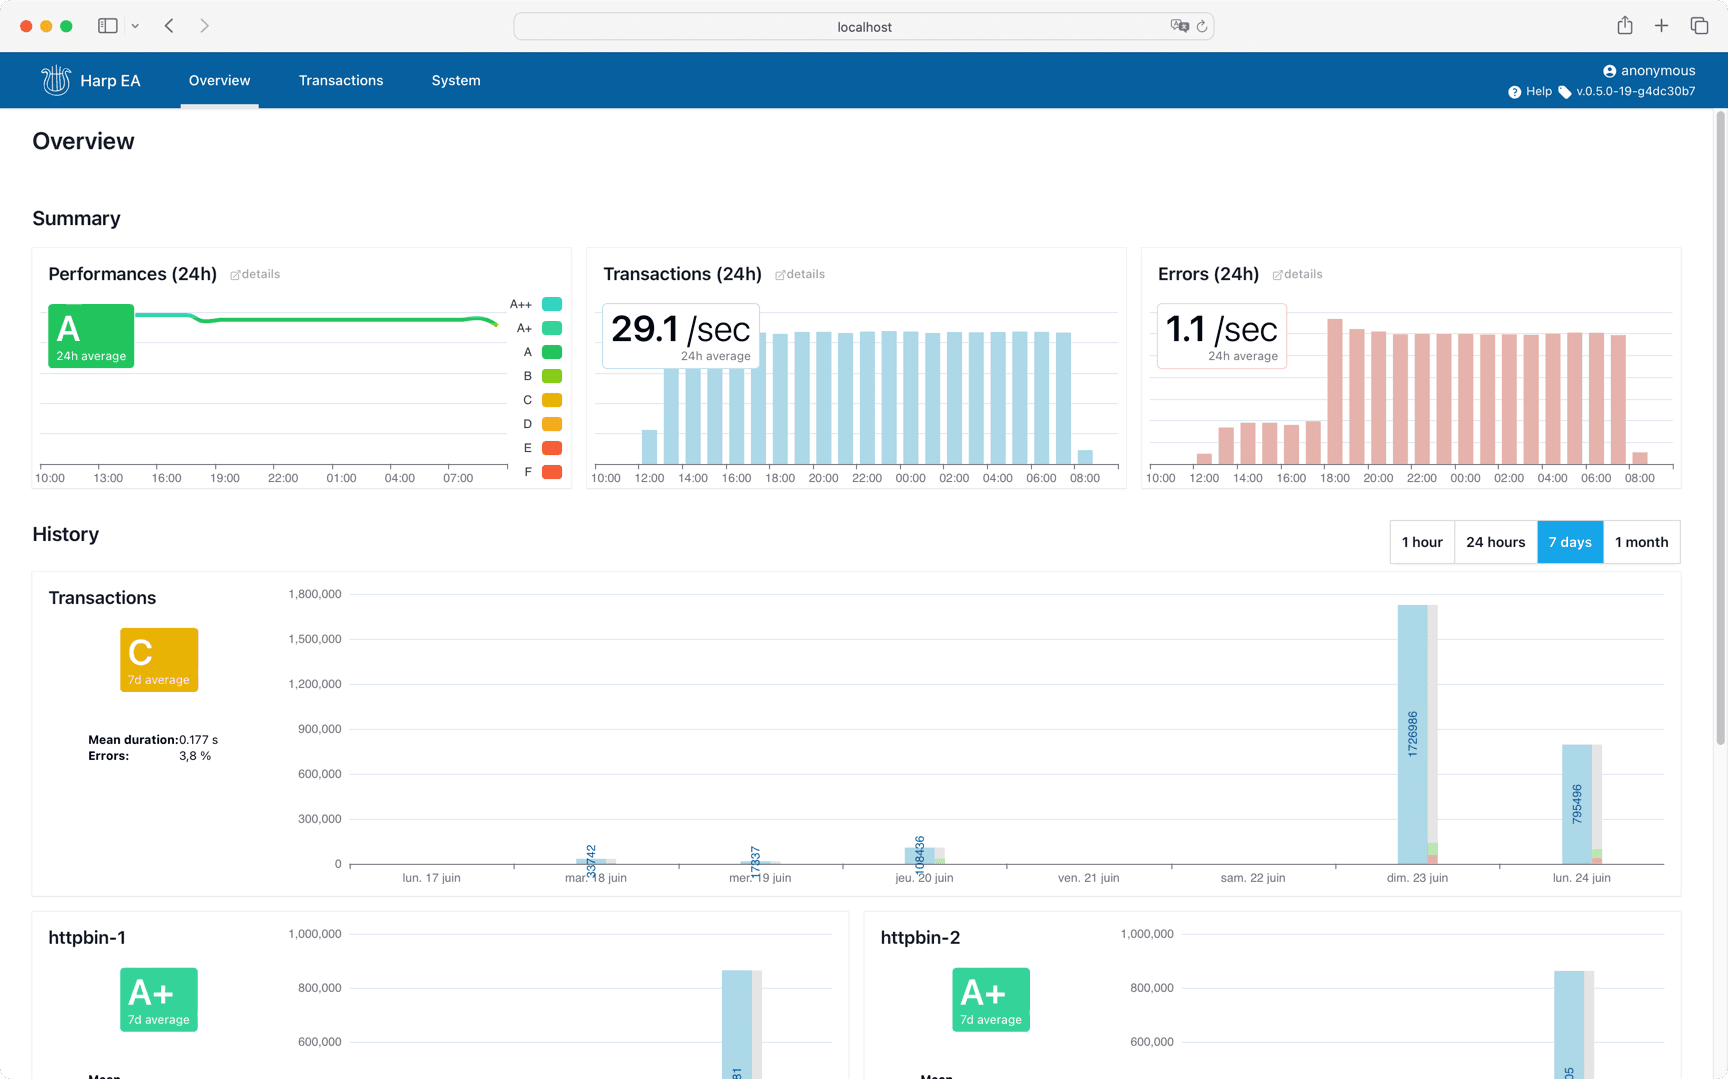
The HARP Proxy Dashboard provides comprehensive observability features, allowing you to monitor and analyze your API interactions effectively. It includes an overview page with aggregated statistics and a detailed transactions list.
Overview Page
The overview page offers a high-level summary of your API interactions, presenting aggregated statistics that help you understand the overall performance and health of your services. Key metrics such as request counts, error rates, and response times are displayed in an easy-to-digest format.

Transactions List
The detailed transactions list provides an in-depth view of individual API requests and responses. You can list, search, and filter transactions that occurred within the last months, including the full content of headers and bodies. This feature is invaluable for debugging and performance analysis.

Configurability
The observability features of the HARP Proxy Dashboard are highly configurable. Using the rules engine, you can set up each feature either globally, per endpoint, or on a request basis (even using complex conditionals based on the request content). This flexibility ensures that you can tailor the observability to meet your specific needs and requirements.
Ready to give HARP Proxy a try?
For advanced features and support, check out ApiLab.
